
🔍 Read the full analysis: Steal The Concept: AI And The Twilight Dial For NLC Watching on ThorstenMeyerAI.com

Get business pricing on office and shipping supplies
- Business-only prices and quantity discounts
- Tax-exempt purchasing
- Multiple users, one account, clear invoices
TL;DR
ThorstenMeyerAI.com describes “Noctilucent — NLC Watch at 83 km,” an AI-built exhibition page about real noctilucent clouds. Its interactive solar-depression dial changes the page’s lighting, illustrating how high-altitude clouds can catch sunlight after darkness has reached the ground; the fictional observing project is not a live scientific service.
ThorstenMeyerAI.com has presented “Noctilucent — NLC Watch at 83 km,” an AI-built exhibition page that uses an interactive twilight dial to explain how noctilucent clouds may stay sunlit after the ground below is dark, as described in the original analysis. The page is explicitly a fictional field journal, not a real observing network or live scientific service, while the atmospheric phenomenon it depicts is real.
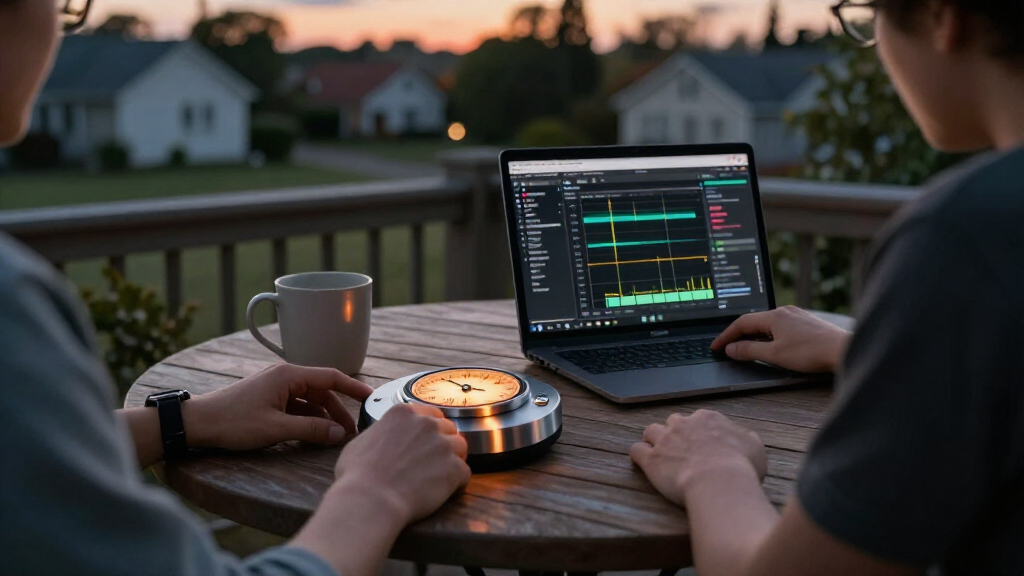
The experience is organized around a solar-depression dial spanning six to 16 degrees below the horizon, with the most visually expressive state near 11 degrees. As visitors adjust it, the page updates several linked features, including sky brightness, shadow depth, cloud glow, ambient color, grain and horizon flare. Supporting diagrams and text are tied to the same lighting state, making the control an explanatory device rather than an isolated visual effect.
The artwork is generated in the browser. According to the source, Canvas renders the twilight sky, stars and wave-like cloud forms, while inline SVG provides diagrams and an altitude illustration. The cloud shapes respond differently: billows use tighter repeating crests, whirls bend into polar distortions, and bands move in broader waves. The page’s palette contrasts electric cyan cloud light with violet and near-black ground-level darkness, before shifting to a cream-colored field-log section.
A later interaction asks visitors to hold a control while simulated haze recedes and a cloud band at 83 kilometres becomes clearer; releasing early lets the sighting fade. The source says the interaction supports pointer, keyboard and touch-like key input. The page also pauses animation when its browser tab is hidden, avoids continuously drawing offscreen scenes and provides a still state for people who prefer reduced motion.
A Dial That Explains Twilight Geometry
The project’s main contribution is its attempt to connect one adjustable scientific variable to the experience as a whole. Rather than show a fixed illustration and explain twilight separately, the dial links the changing position of the sun below the horizon to the appearance of the sky and clouds. That makes the central idea—high-altitude ice can remain illuminated while the observer is in darkness—something visitors can explore through a visual model.
For readers, the distinction between an educational artwork and a research service matters. The page may help communicate the conditions associated with noctilucent clouds, but the source describes its observing stations and project as invented. It does not report actual sightings, collect field observations, or provide a live forecast. Its value is therefore in science communication and interface design, not operational monitoring.
The interaction also makes patience part of the explanation. Visitors must hold the control to see the simulated cloud band sharpen, linking the act of waiting with a night watch. That is an artistic choice, not evidence that real sightings follow the same on-screen timing. The experience illustrates a concept; it does not replace atmospheric measurements or observations.
night sky telescope for astrophotography
As an affiliate, we earn on qualifying purchases.
As an affiliate, we earn on qualifying purchases.
From Mesosphere Science to Browser Art
Noctilucent clouds are high-altitude ice clouds in the mesosphere. The source describes them as able to remain sunlit after the ground has entered darkness, because sunlight can still reach their altitude at particular twilight angles. The exhibition places its imagined clouds at about 83 kilometres and builds its visual explanation around the sun’s depression below the horizon.
The supplied material identifies this piece as room 162 of 175 in a series and says its construction process involved three passes: building a working page, reviewing it for clarity and interaction, and conducting an art-director review. A companion design guide is said to document the implementation. The source also outlines a broader creative brief involving seasonal observation and fictional station logs, but these are elements of the designed experience, not records from actual stations.
The technical approach described is deliberately self-contained: HTML, CSS, JavaScript, Canvas and inline SVG, with no image assets. The source says the project uses browser-generated visuals and visibility-aware animation. Those details explain how the scene is made; they do not independently verify the scientific accuracy of every visual or the performance of the page on all devices.
“A fictional field journal for a fictional observing project, not a real company or live scientific service.”
— ThorstenMeyerAI.com, describing the exhibition
What the Interactive Model Cannot Confirm
The supplied material does not provide a publication date, a link to independently inspect the live page, or results from scientific review of its diagrams and explanations. It also gives no performance measurements, user testing data or evidence that the page’s simulated lighting corresponds quantitatively to atmospheric conditions. The stated six-to-16-degree range and the approximate 11-degree visual emphasis are described as design parameters; the source does not present them as a forecast or a guarantee of visibility.
There is also no evidence that the fictional stations represent real observers or that the page receives live data. The source expressly says it is not a live scientific service. Whether the project’s design guide includes further technical or scientific qualifications is not detailed in the supplied material.
The Design Guide and Live Experience
The source points readers to the live exhibition page and an accompanying construction guide for a closer look at the interaction and implementation. No future release, research partnership, observation schedule or live-data feature is announced in the supplied material. The next verifiable step is therefore inspection of those linked materials; until then, the project is best understood as an interactive, AI-built science-art presentation, rather than a new monitoring tool.
Key Questions
Is NLC Watch a real cloud-observation service?
No. ThorstenMeyerAI.com describes it as a fictional field journal for a fictional observing project, not a live scientific service. No real-time observations or forecast capability are claimed.
What does the twilight dial change?
The dial covers a stated range of six to 16 degrees below the horizon. Moving it changes the page’s modeled sky light, shadows, cloud glow, colors and related diagram details.
Are the clouds and their altitude real?
Noctilucent clouds are real, and the page depicts them at about 83 kilometres. The exhibition’s cloud forms and observations are generated or invented for the experience, rather than presented as live sightings.
How is the artwork rendered?
The source says the page creates its visuals in the browser using Canvas, inline SVG and CSS, without image assets. It also describes animation that pauses when the tab is hidden and a still state for reduced-motion settings.
Source: ThorstenMeyerAI.com
Halloween Picks
halloween
As an affiliate, we earn on qualifying purchases.